OEE (Overall Equipment Effectiveness) Dashboard
Want full insight into your production? Let us build you an OEE analytics system with custom dashboards.
Maximize Your Production Efficiency with Our Advanced OEE Dashboard
Unlock the full potential of your manufacturing operations with our OEE Dashboards. Gain real insights into your equipment effectiveness to identify bottlenecks, reduce downtime, and boost productivity.
Our dashboards are designed custom for your specific business needs. We provide a comprehensive solution that not only monitors performance but also guides your continuous improvement journey. Make data-driven decisions with confidence and elevate your process maturity to new heights.
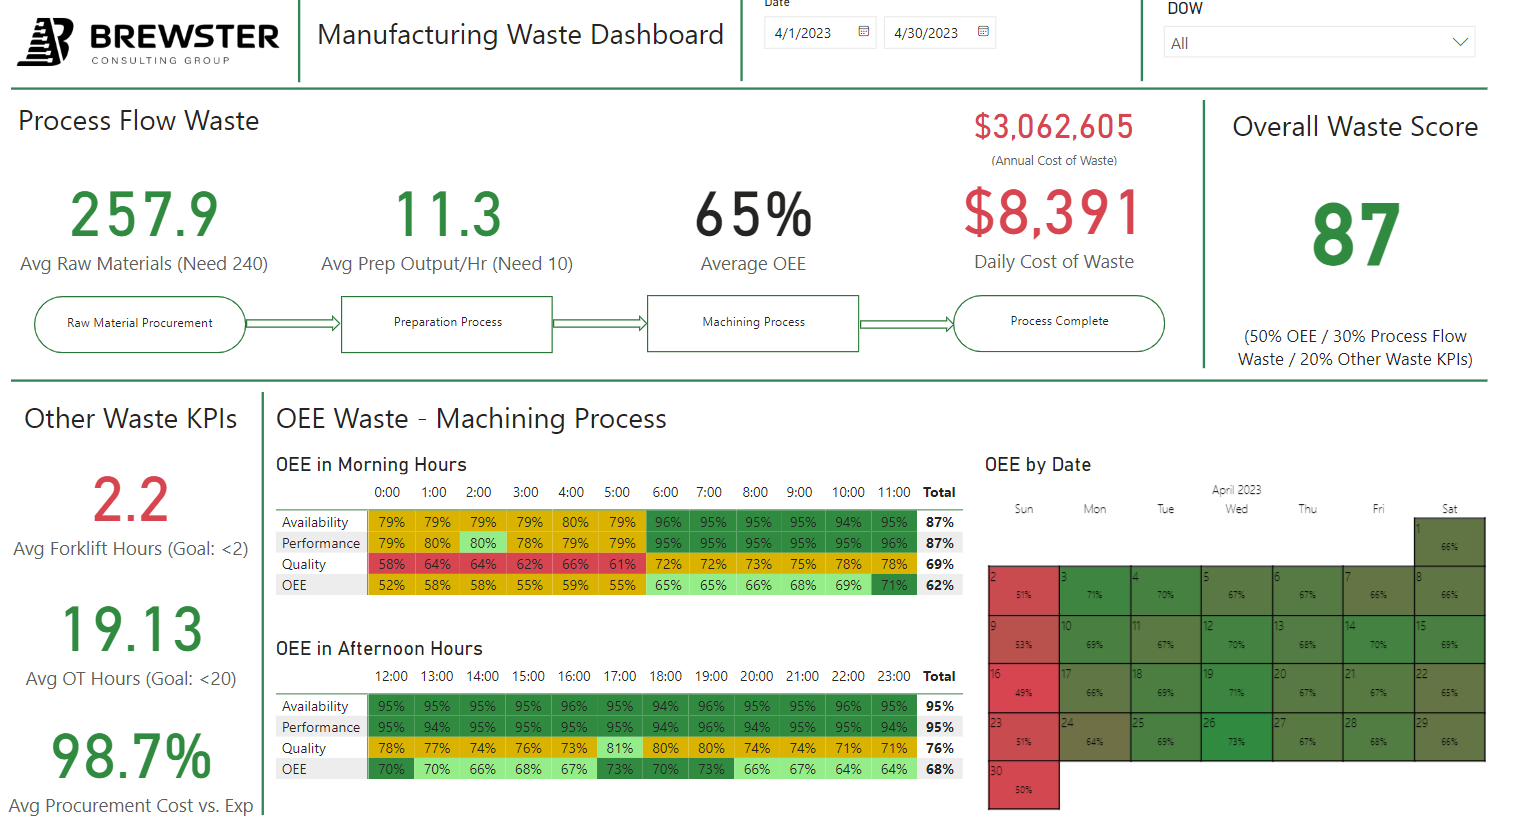
See an example of a past dashboard below:
This video dives into leveraging Overall Equipment Effectiveness (OEE) to reduce manufacturing waste and improve operational efficiency.
Understanding OEE:
- OEE Formula: Calculated as the product of Availability, Performance, and Quality.
Impact of Each Component:
- Availability: Reflects the actual runtime versus the scheduled runtime.
- Performance: Indicates the process speed relative to its maximum potential.
- Quality: Measures the percentage of defect-free products.
Lower OEE translates into lost revenue and increased waste. If you're interested in building the OEE capabilities of your organization, you can start by scheduling a meeting with us to discuss an OEE dashboard.
Frequently Asked Questions About Overall Equipment Effectiveness and OEE Dashboard
At Brewster Consulting Group, we often hear questions about Overall Equipment Effectiveness (OEE) and an OEE Dashboard, so we’ve compiled a list of FAQs to clear up common misconceptions. Our goal is to empower small and mid-sized businesses by harnessing the power of data analytics for enhanced efficiency and informed decision-making.
What does OEE stand for?
OEE stands for Overall Equipment Effectiveness.
What is an OEE Dashboard?
An OEE dashboard is an analytics tool that provides valuable insights into production performance by tracking key metrics such as real-time equipment effectiveness, KPI monitoring, shift progress, machine quality issues, and equipment status.
What does OEE measure and why is it important?
OEE measures the performance and efficiency of manufacturing equipment, offering valuable insights into operational effectiveness. It is essential for identifying areas of improvement and enabling data-driven business decisions.
How does an OEE dashboard differ from other performance tracking tools?
An OEE dashboard stands out from other tracking tools by offering real-time data and the flexibility to monitor performance across various timeframes, such as hourly, daily, or monthly, and by shift. Its visual representation of data enhances clarity and helps stakeholders quickly interpret key insights.
What industries benefit most from an OEE dashboard?
OEE dashboards are particularly beneficial in industries where maximizing equipment utilization and minimizing downtime are critical to operational success. A few of the most common industries are parts manufacturing, food and beverage processing, and tech manufacturing.
How do we get started with an OEE dashboard?
Start by scheduling a call with us to discuss your business concerns and pain points. We will assess your needs and propose a tailored OEE Dashboard Plan which will outline the scope of work and engagement terms.
How does pricing and billing work for an OEE Dashboard?
Prices vary based on the level of engagement, size, and complexity of your organization.